IS ENGLAND READY FOR 4th JULY? THE DATA SAYS DEFINITELY NOT

Are we ready? We weren’t. But has the situation improved sufficiently to make these easings?
To answer that question, and understand and manage the pandemic in the general community, we need to understand what is happening to new infections. These are also known as “new cases” as a result of “transmission” of the COVID-19 disease by the SARS-COV-2 virus:
- Whilst death and hospitalisation data is important, these events occur some weeks after transmission, and are therefore not sufficiently timely
- There is no data directly relating to transmission. All data has an inherent delay, as explained in each case below. In particular:
- Symptoms do not occur until at least 5 days after infection
- Testing typically takes 2 days or more to produce results
- People can remain asymptomatic yet are still contagious.
We also need to understand the R number, being the average number of people each infected person infects:
- An R over 1.0 means infections are increasing
- Below 1.0 they are falling.
- Just below 1.0 and they are only falling slowly.
SPOILER
As analysed below, the daily infections in England are still too high to go ahead with easings tomorrow, Saturday 4 July. These easings should be deferred.
The R numbers around the regions are at or too close to 1.0, meaning daily infections have only been falling slowly.
But due to time lags in the data compared to actual infections, we have at least a week’s gap in data up to today. In that time increases in Leicester and apparently in other places like Bradford suggest infections may have risen.
Indeed the plan for tomorrow should be replaced by a short, sharp second lockdown for 3 weeks to get infection levels right down, after which easings can be more substantial. Producing a stornger economic recovery, lower death rates and let life get back to near-normal. As long as we then continue to take sensible precautions, which we are going to have to do in any case.
DATA SOURCES
Let’s take a look at the latest available data on new COVID-19 infections. All but one of the data sources were updated yesterday Thursday 2 July:
- The “Confirmed New Cases” graph that had been a regular feature of the daily press briefings, now superceded by the following data from the Department of Health and Social Care, which was the original data source
- Department of Health and Social Care testing data including “Got it” tests for:
- “Pillar 1” for hospital admissions and for frontline staff
- “Pillar 2” in general community
- The Office for National Statistics “COVID-19 Infection Survey”
- King’s College London “Coronavirus Symptoms Study” using the ZOE app
- R value for UK, and regional analysis, unusually updated last Thursday and probably released later today, Friday
- The Westminster government are only responsible for the pandemic response in England, which is the focus of this blog post. We need to carefully distinguish England data from the total for the UK
- We need to distinguish daily infections from those who ‘have’ COVID-19. It is daily infections that matter, which then feeds in to the total number of infections
- Test that involve swabbing are prone to substantial ‘false negatives’. This is due primarily to the difficulty of taking swabs, and tests often have to be repeated before a positive result is obtained when symptoms are clear. Where self-swabbing is involved, such as where tests are sent out to people’s homes, the ‘false negative’ rate is higher due to the difficulty in self-swabbing, and lack of repeat tests. Estimates of false negatives are around 30-40% ‘False positives’, saying someone has the disease when they don’t are negligible by comparison, but can include where there is residual viral RNA after symptoms have ceased
- Timing. How close to actual transmission does the data reflect?
So without further ado, let's look at the data:
“NEW CONFIRMED CASES” GRAPH
This is a graph of data derived from official testing for the UK, and was last published on 26 June.
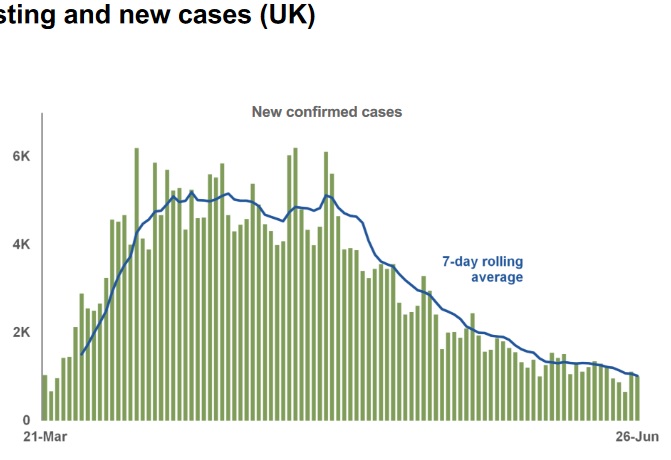
This data continues to be updated, so let’s look at it next, and just for England.
OFFICIAL DATA PUBLISHED DAILY BY DEPARTMENT OF HEALTH AND SOCIAL CARE
The daily tests and confirmed cases data is published daily [LINK], which includes a link to the historic data .
The relevant data included is:
- Pillar 1 tests (column 1), primarily in hospitals for those with symptoms and front line workers
- Pillar 2 tests (column 2), being in the general community, for people who have symptoms
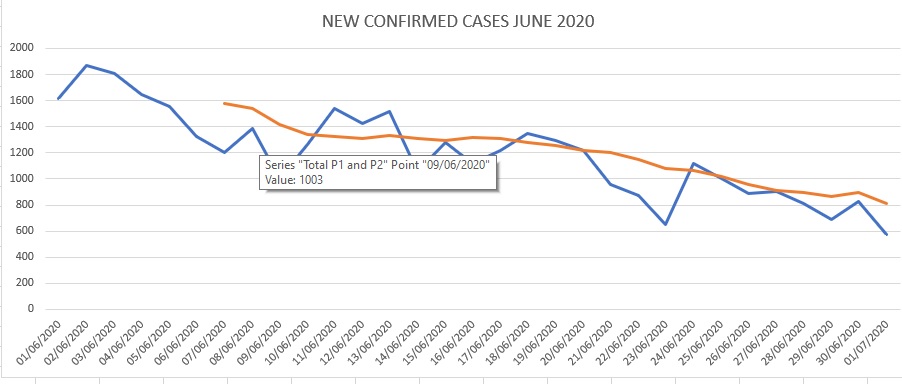
The combination represents the total number of cases in the community. Where someone has tested positive in pillar 2, when first infected, they are no longer double-counted in pillar 1 on admittance to hospital.
When the combination is graphed for June up to tests on 1 July, this is a magnified and extended version of the right hand side of the graph above:
- Pillar 2 only includes people who submit to a test. Not people with symptoms who do not volunteer
- Nor those who do not return a test sent to them at home
- 'False negatives' can be 30%-40% due to the difficult of swabbing, as explained above.
From a timescale perspective, the earliest a test will take place is typically when symptoms occur, with some tests only on hospitalisation. Data therefore lags transmission by at least 7 days.
We might therefore expect the true number of daily infections to be 2-3 times these figures. So when the PM or anther minister says “infections are under 1000 per day”, referring to this data, this probably means over 2000 per day in the 7 days to 24 June in reality.
OFFICE FOR NATIONAL STATISTICS “COVID-19 INFECTIONS SURVEY”
This data is obtained by testing a wide selection of families, reflecting every sub-section of the general community in England. This is whether people are symptomatic or not.
This means that a positive test can be across a wide range of time, from before symptoms to sometime afterwards. Again let’s assume an average of 7 days after infection, but could be longer.
This survey is called a “pilot” because sample sizes are really too low to give an accurate measure nationally at lower infection rates. Certainly not enough for meaningful regional analysis, although the ONS tries. It is hoped that substantially increased sampling will occur across the whole of the UK, and be funded. Important.
Here is the main message on transmission, or "Incidence Rate". There have been some
3500 new infections per day (95% confidence interval: 1715 to 6285) in
the 2 weeks to 27 June, and infections have “now levelled off”:
In graphical form:

If we assume a 7-day lag, infections in the 2 weeks to 20 June were well over 1700 per day, and likely to be around 3500 per day. Maybe rising slightly..
KING’S COLLEGE LONDON “COVID SYMPTOMS STUDY”
The King’s College data is derived from the ZOE app, used by nearly 4 million people. It is based on symptoms, which are at least 5 days after infections, say 7 says on average.
The stats reflect users of smartphones and therefore exclude people who do not own one who are likely to be poorer. As conditions can be worse for poorer people, and this can result in a higher level of infections, the ZOE data should be regarded as the minimum level of infections.
The report has been published on 2 July for the period to 28 June. This shows for England that:
- New cases stabilised around 2000 in the 2 weeks to 24 June, implying R was 1.0 for infections in the two weeks to 17 June (higher than the official R was 0.7-0.9 for the UK}
- Daily cases have since dropped to 1252 on 28 June (in range 878 – 1787 with 95% confidence), effectively for 21 June. R is estimated as 0.8 in those last few days
- This is good news. But we don’t know from this what has happened since 21 June, which has included the rise in Leicester.

R VALUE FOR UK AND REGIONAL ANALYSIS
The R value and rate of change, as explained above, does not provide a view of daily infections. But the data is important in its own right.
The official page shows “Last updated on Thursday 25 June 2020 “, and it is hoped to be later today Friday
On Friday 19 July, Sir Patrick Vallance’s twitter feed showed the data had been published on a different web page from normal. There is no tweet since then about R, not even on 25 June.
It’s worth bearing in mind that this R number used to be primarily back-calculated from hospitalisations and death, and was officially 2-3 weeks out of date. More recently other data has been taken into account, and it is not clear how out of date it is.
An analysis of this timing issue with R and alternative measurements can be found here.
REGIONAL R NUMBERS
The official R number has more recently been accompanied by a regional analysis. Whilst this is awaited, here is the regional analysis of R numbers from the King’s College ZOE study for the period up to 28 June, effectively reflecting infections just before 21 June:
0.8 Total England, and then in descending order:
1.0 South West
1.0 South East
0.9 East
0.8 London
0.8 Midlands
0.7 North West
0.7 North East
0.8 Total UK
0.9 Scotland
0.8 Wales
In Northern Ireland infections are too low, having generally followed anti-COVID-19 measures of the Republic of Ireland, which also now has very low infection levels
CONCLUSION
At the beginning of May, Professor Chris Whitty is reported as saying that daily infections should be below 1000 per day to be able to ease lockdown restrictions . Indeed France, Spain and Germany have waited until daily cases are under 500, ignoring local spikes.
We are still at Alert Level 3 “epidemic is in general circulation”, not level 2 “case/transmission low”. Level 2 is where we need to be to make significant easings to lockdown restrictions. Just as is happening on the continent and in Ireland.
What about daily new cases in the latest data?
- The PM said recently that new cases are “under 1000”. But this is the raw DHSC data, which we know is inherently understated. A figure in excess of 2000 per day just before 24 June is more realistic.
- The ONS “COVID-19 Infection Survey” suggests infections were some 3500 (1715 to 6285 at 95% confidence) per day just before 20 June
- The King’s College London ZOE data suggests around 1500 on 21 June, with R numbers just below 1 in most regions.
That means daily infections are still well above the 1000 per day Prof Whitty advised was the threshold for easings. Indeed Spain, France, Germany are only easing restrictions now their daily rate is below 500 per day, with similar population sizes. Ireland too is at a far lower level.
So England is not ready for the easings tomorrow 4 July. The level of infections has not reduced sufficiently to do so.
Rather than being good for the economy, we would be expecting low consumer confidence, a slow recovery in the economy. Indeed risking a rise in infections that would make matters even worse. Plus a higher death toll than necessary.
PROPOSAL

That is an immediate short sharp second lockdown for three weeks to get infections right down to continental levels. Accompanied by a better set of anti-transmission measures and public information campaign to keep infections down.
Sure there will always be local flare-ups like Germany has recently experienced. But a short second lockdown would put England on a much stronger footing to get back to normality, with a much stronger recovery in the economy.
At lower infection levels, a lower death count too. Plus many other benefits. Details of benefits and practical considerations of the proposal are here .
So rather than easing the lockdown tomorrow, Saturday 4 July, there should be an immediate second lockdown for three weeks. Every day delayed is benefits foregone. Let’s do it now.


Comments
Post a Comment